How to deal with trendlines.
Hi, i’ve get an question from David, who asked me: “Is there a way to make the grid/box a perfect square. It makes 45deg lines easier.”
I thought – it can be useful to others to know too – how to deal with not perfect grid/box square.
So there is short instruction how i deal with that:
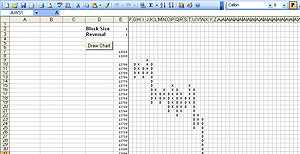
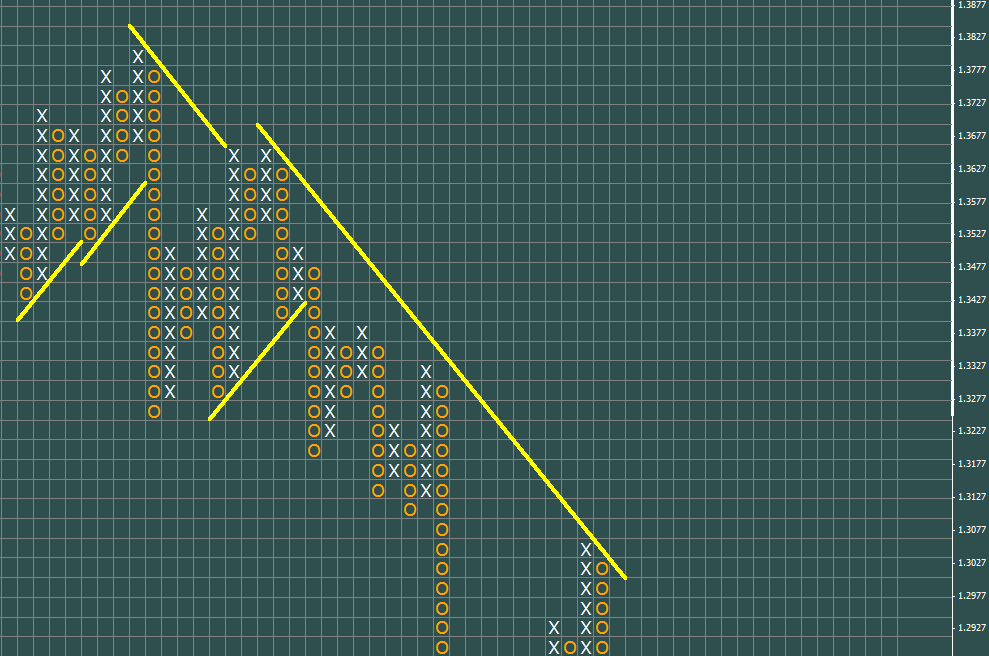
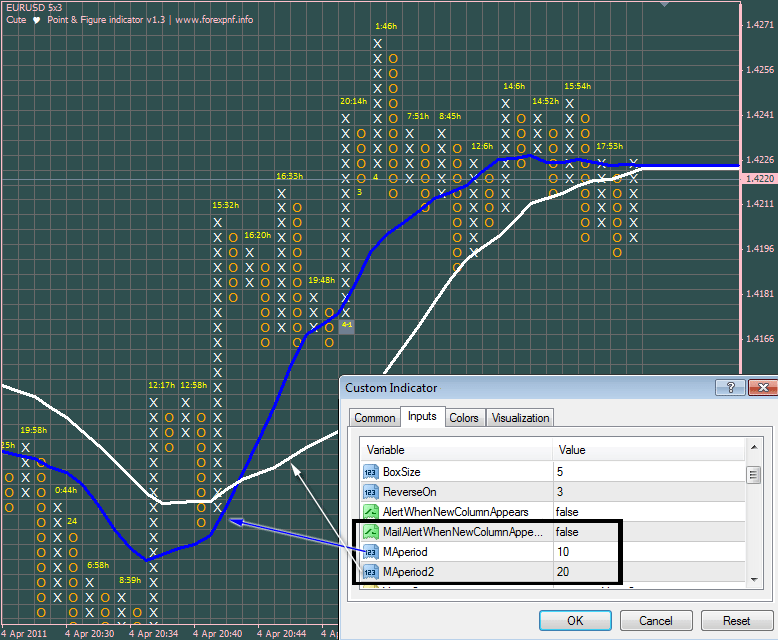
1. Zoom in(at max) cute pnf chart’s window – to see the bigger boxes. Start dragging trend from edge to edge of the grid(look prints creen below).

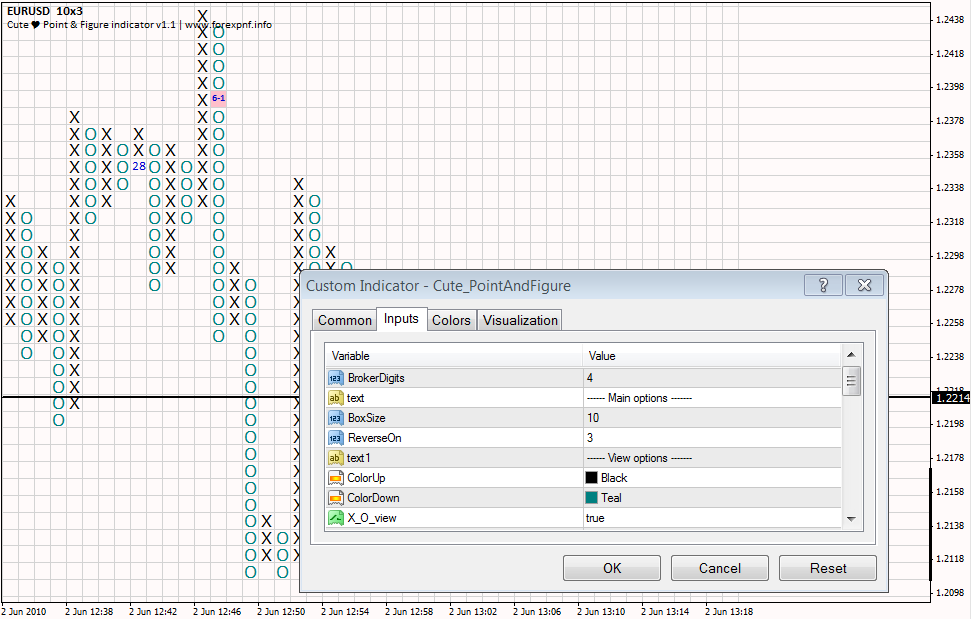
2. Go to attached trend properties and rename it to “trend1”. (why? – find answer here – plotting trend-lines)

3. Click right mouse button on the attached … trend line and select “unselect all”.

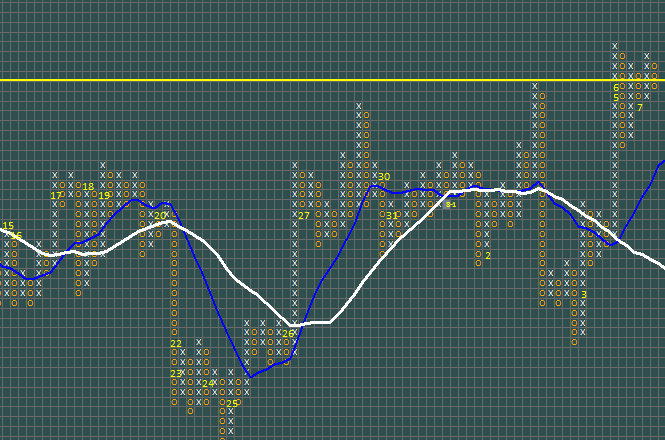
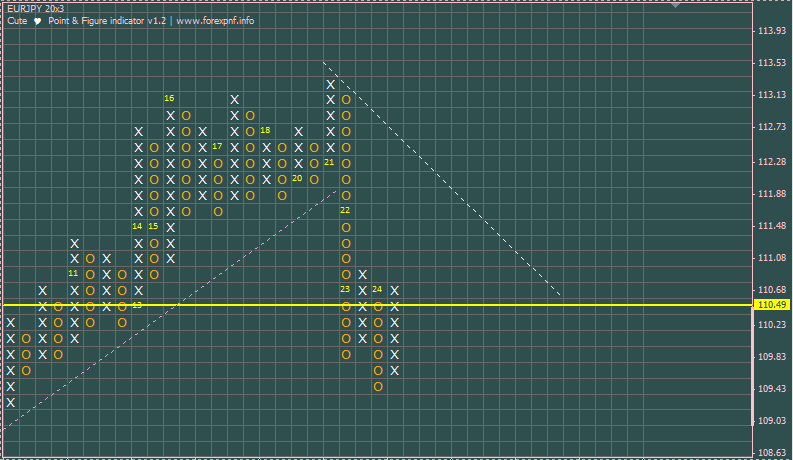
4. Zoom-out(with magnify +- button) Cute PnF chart. It’s possible that you will need to adjust X (time) and Y(price) axis to gain view like that one below:

5. If needed, you can change other trend properties (color, line width, style).

6. Also, if needed, you can attach second, third or fourth trend line (i.e. to draw price channel). But don’t forget to rename it consistently “trend2”, “trend3” or “trend4”. Find more info about plotting trend lines by pressing here.


Cool! Trendlines are an absolute must, and many other programs go wrong with the scaling. This one looks much better.