Point and Figure patterns added
Hello, nice to see you again!
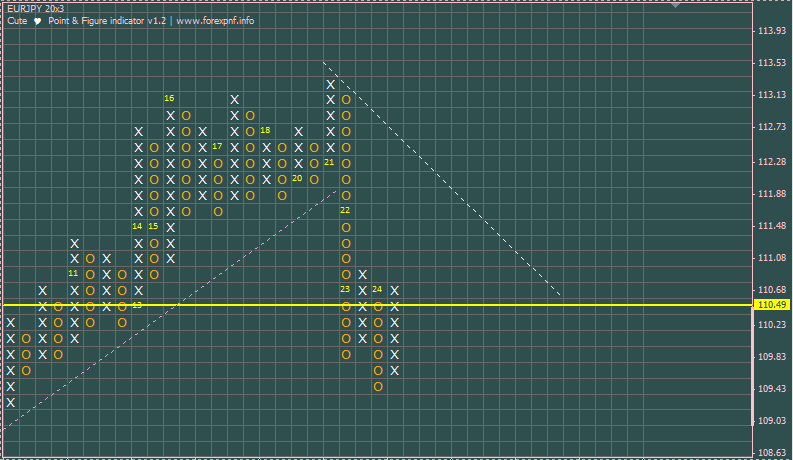
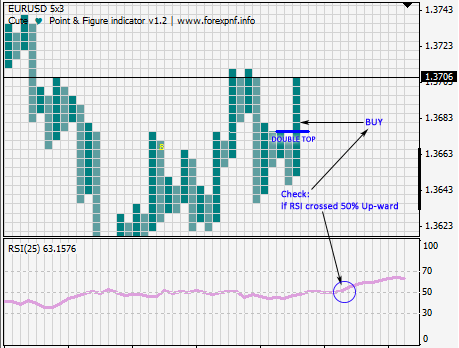
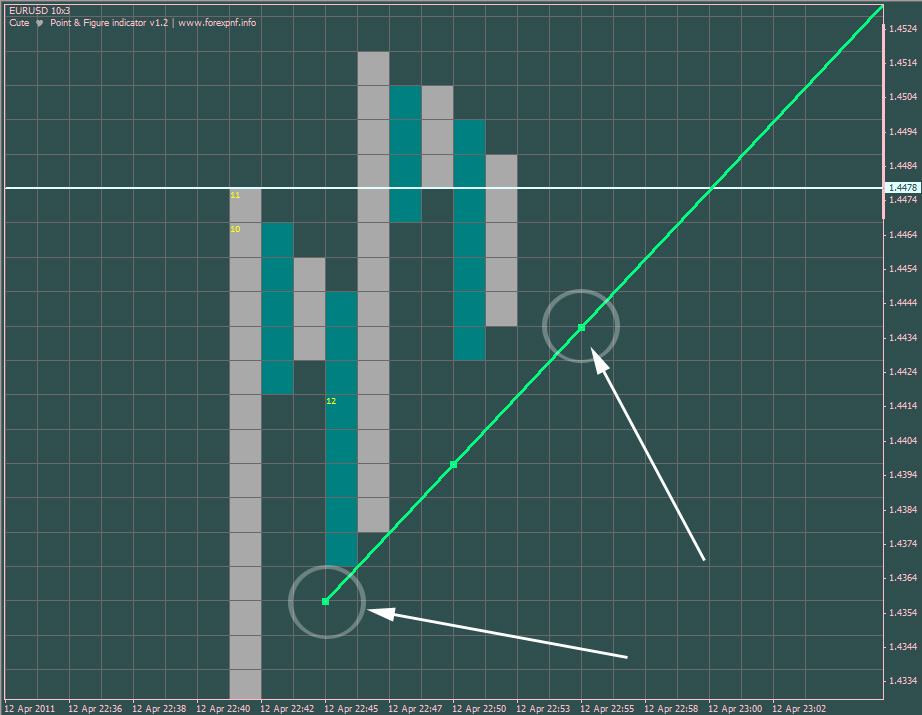
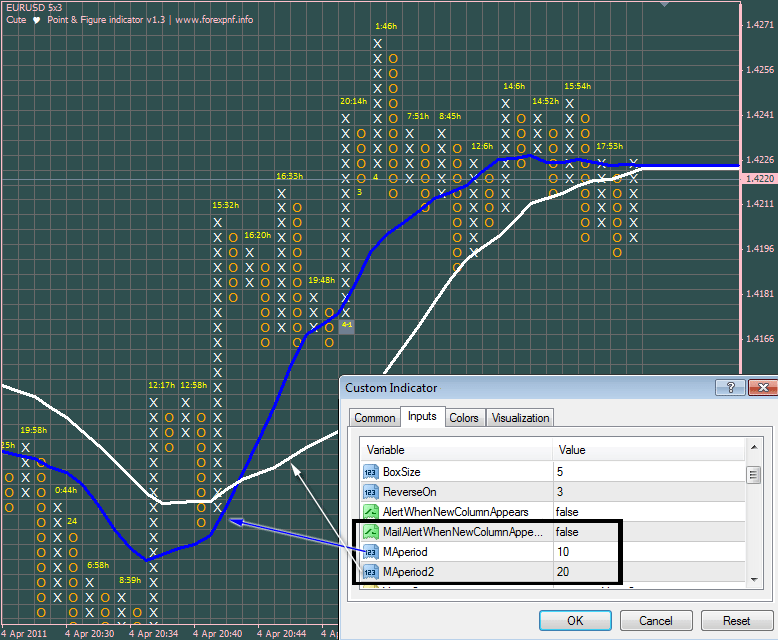
Point and Figure pattern is special X’s and O’s column’s formation, which give us more clear and filtered view of a chart, which we trade on.
Decision – when to “buy/sell” or “wait” – is everyones individual thing. There are a lot of factors which may influence trader to make his own trading decisions when trading with Point and Figure charts. One of such factors are – Point and Figure patterns(meaning described above). These patterns give us opportunity to detect common “buy/sell” or “wait” signals.

So, I wish to inform you about new blog section – point and figure patterns (search in upper menu under “Point and Figure” button. This blog section will include almost all of the Point and Figure charting patterns.
For more details of pnf charting patterns follow these links:
* bullish pnf patterns
* bearish pnf patterns
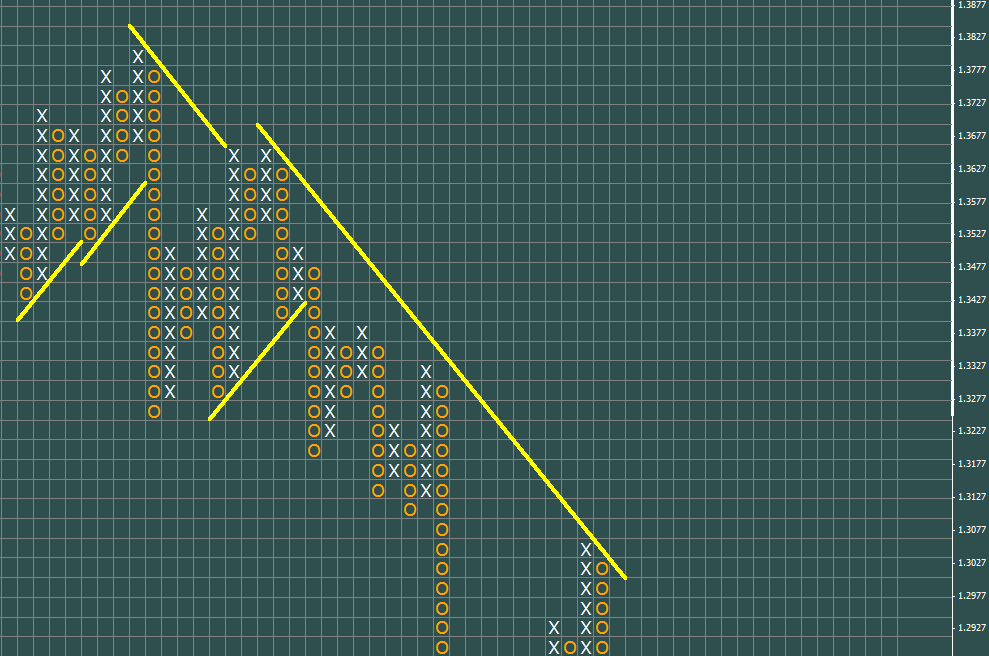
* bullish pnf trend reversal patterns
* bearish pnf trend reversal patterns
* all pnf trend reversal patterns
* “wait and” see patterns
Remember that patterns are only one of few things we look at when making trading decisions. For example – when the market indicators are suggesting that demand is
in control of the overall market, then the bullish patterns work out better than bearish and vise versa – when the main market indicators are suggesting supply is in control of the overall market, then the bearish patterns work out better than bullish. Patterns are especially useful in determining entry points and logical stop loss points.
Hope this info will help you to spot buy/sell signals more clearly and to trade more accurately!
See you soon mates!


Newest comments