Point and Figure MS Excel Spreadsheet (free)
Hey there,
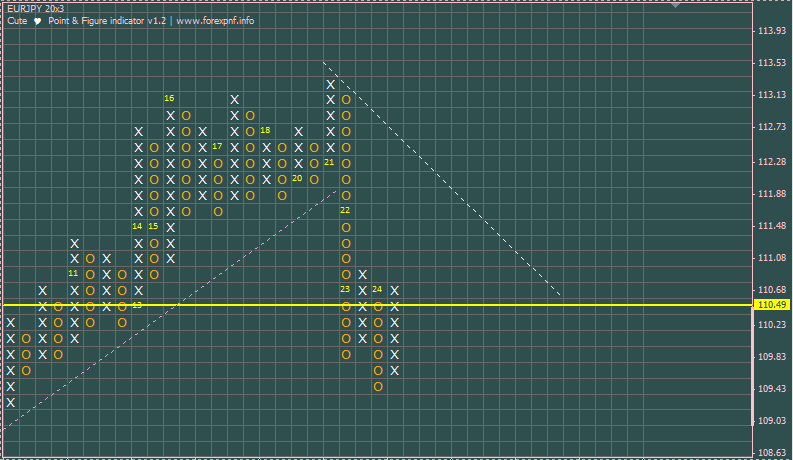
some of you were asking about MS Excel Spreadsheet for drawing PnF charts.

So here it is, free to download and use. Press here to download.
*If download doesn’t start – try to click right mouse button and select “SAVE LINK AS.”
Feel free to use it with your own history data(which can be exported from MT4 or online history centers).
Later i will create short instruction how to use it and post it here.
Have a good time!


Hi Michal,
Can you provide me the instruction link how to export price ftom mt4 to microsoft excel for plotting point and figure chart.
Kind regards,
Krishnan
Hello Krishnan,
sorry for answer delays, there is no instructions on – how to do it. But i will advise you to do it in this way:
Run your MT4 platform, then Main menu -> Tools -> History Center , find there pair which you need, expand it (+) double click on TF (*i suggest you to use M5(5min) – it will show more accurate price jumping). And press EXPORT button below. As a result you will get .csv file, which you will be able to open with MS EXCEL.
After opening pnf_excel_chart.xls file, go to OHLCV sheet and import in same format your .csv file. After importing .csv file make sure your price digit data is same like in yout MT4.
Hello Micael,
Thanks for your detailed explanation on the pnf chart in excel. I downloaded the csv file and imported to OHLCV sheet and got it right till this point. After this i am unable to update the chart.
If i press draw chart the whole sheet goes blank. I am not sure is there any other formula or linking i should do. please advise.
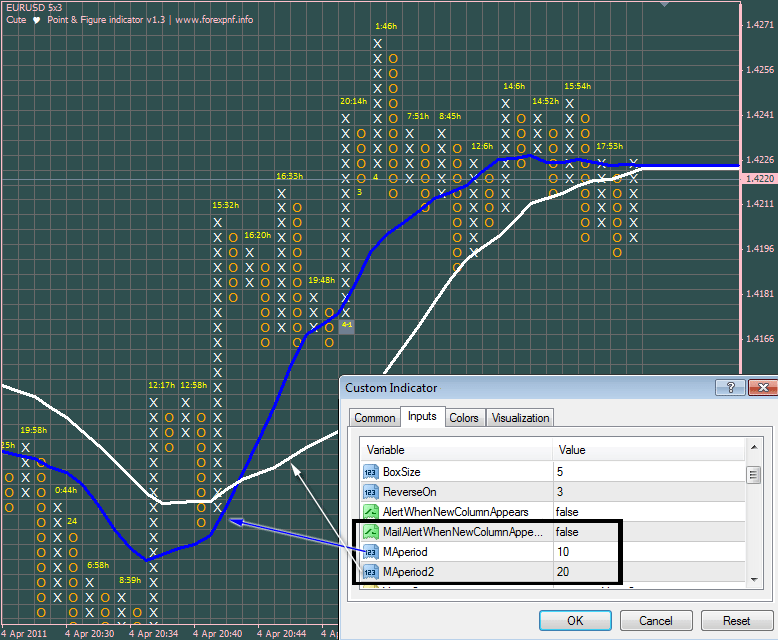
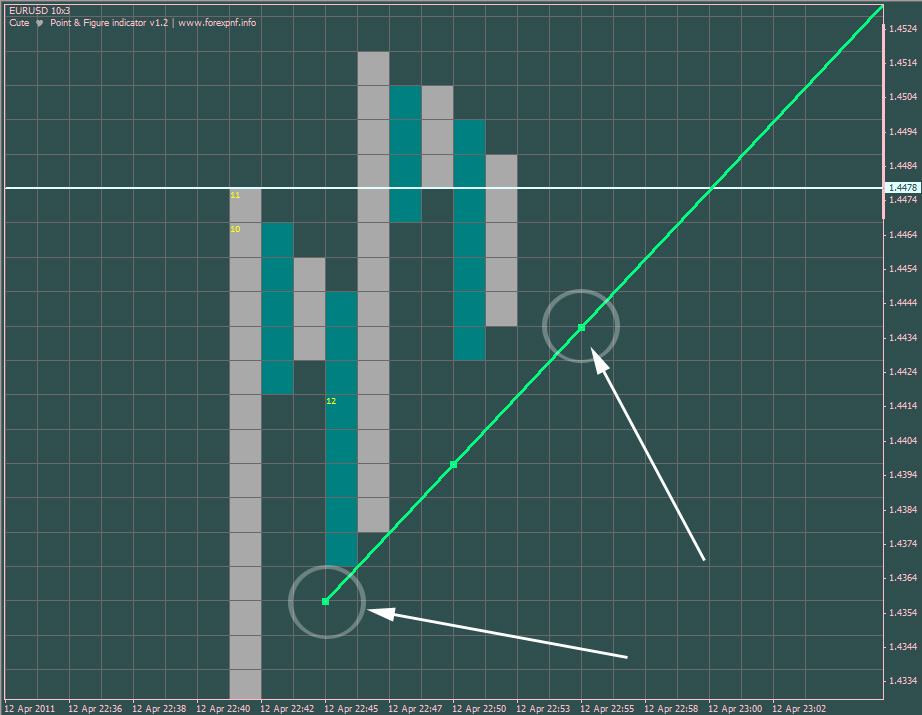
I am currently using v1.3. I am still having difficulties in drawing the trend line. After i draw and rename it as trend 1, line is not saved and still continues to move. Once i close the mt4 and open again, all the lines are gone. Please guide me how to resolve this. I have seen your video and followed it exactly, still unsuccesul.
Regarding the Moving average if i use less than 8 the MA line falls down steeply. Is 10 the minimum MA that can be used in V1.3?
Do you have plans to introduce EMA cross over in point and figure chart.
Kindly share your views.
Kind regards,
Krishnan
Hello Krishnan,
strange that you get blank window after pressing UPDATE(draw). Maybe your OHLCV data is without comas or its format is other than the default one , which is in pnf_excel_chart.xls file by default?
Krishnan, you mentioned “trend 1” but pay attention – there must be “trend1”, “trend2 …”, “trend4” without space between “trend” and “1”. Also you must remember that Closing and Starting (restarting) MT4 drops all trend lines in current chart, because indicator is recounting all history bars.
To avoid that and to have trend lines sticky to chart i suggest you to set all trend lines you need, name it – trend1, trend2 …. and save your Template by going to MENU -> Charts -> Template -> Save Template. Next time when you’ll start your MT4 and find that trendlines disappeared, just load your saved template.
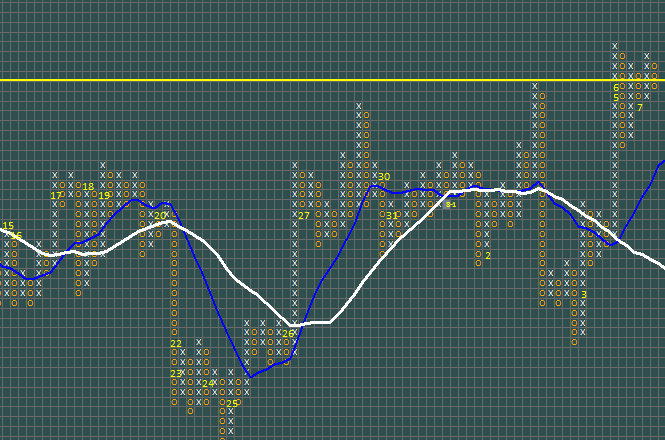
Minimal Moving average must be 2 or 3, but i strongly suggest you to use 10 or higher one, because from my point of view PnF charting method is not suitable for quick scalping, and short averages waves and small crossings can be deceptive and fake.
We have problems in upgrading Cute PnF indicator for other versions because of the split of our programming group, so at the moment all future researches are frozen. 🙁
Thanks for contacting and for nice words about indicator. Hope it’ll make you less problems now.
Best wishes!
Michal
Hi Michal!
I want to say thanks for that great work! But I hav a question: What I have to change in the VBA-Code, if I my datas in the ohlcv sheet starts in line 5 or 6?
Hope you read this after 2 years 🙂
Heyy Kurt,
have you tried to move up your OHLC data by those 5-6 cells in the top direction? 🙂